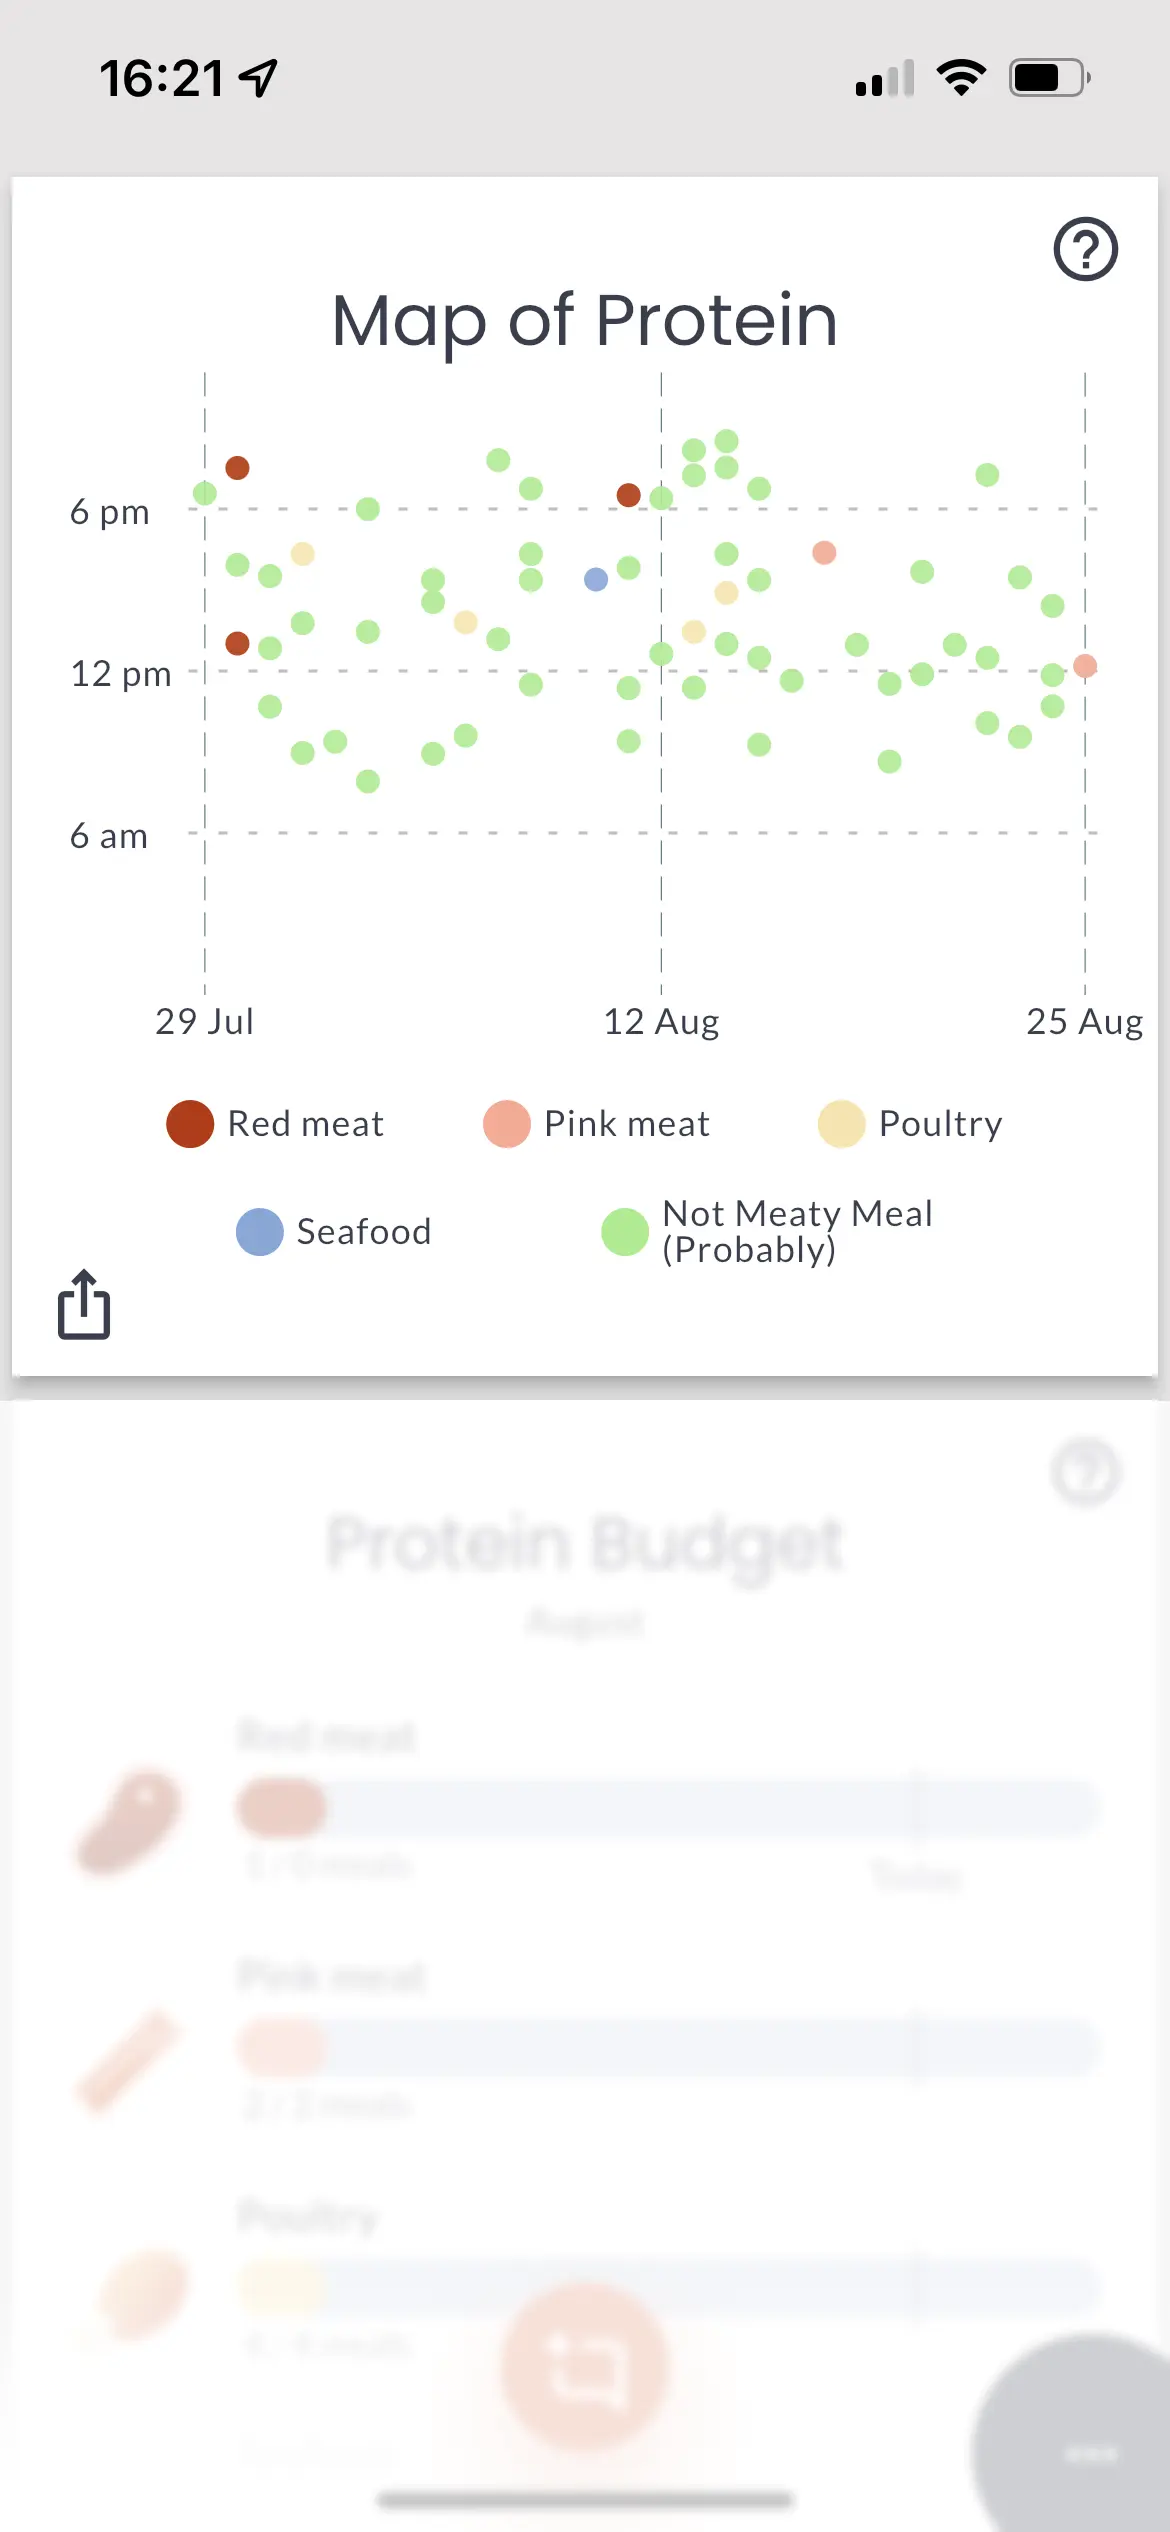
Map of Protein
Map of Food allows you to quickly "see" your eating patterns, with a focus on predominant proteins in a given meal.
In the chart, each dot represents a meal. The colour is determined by the most environmentally heavy protein (red meat, seafood, "pink meat", poultry, other).
On the X-axis is the date of the meal (left older, right more recent). On the Y-axis is the meal hour - the lower, the earlier.
You can tap anywhere on the chart to toggle between a 7-day and 30-day view. Tapping on the "More" button allows you to dive deeper into the munching history with a 30-day chart, the ability to search for specific meals and see meal details.
The consumption can be tracked across a few categories of animal products.
Protein Budget
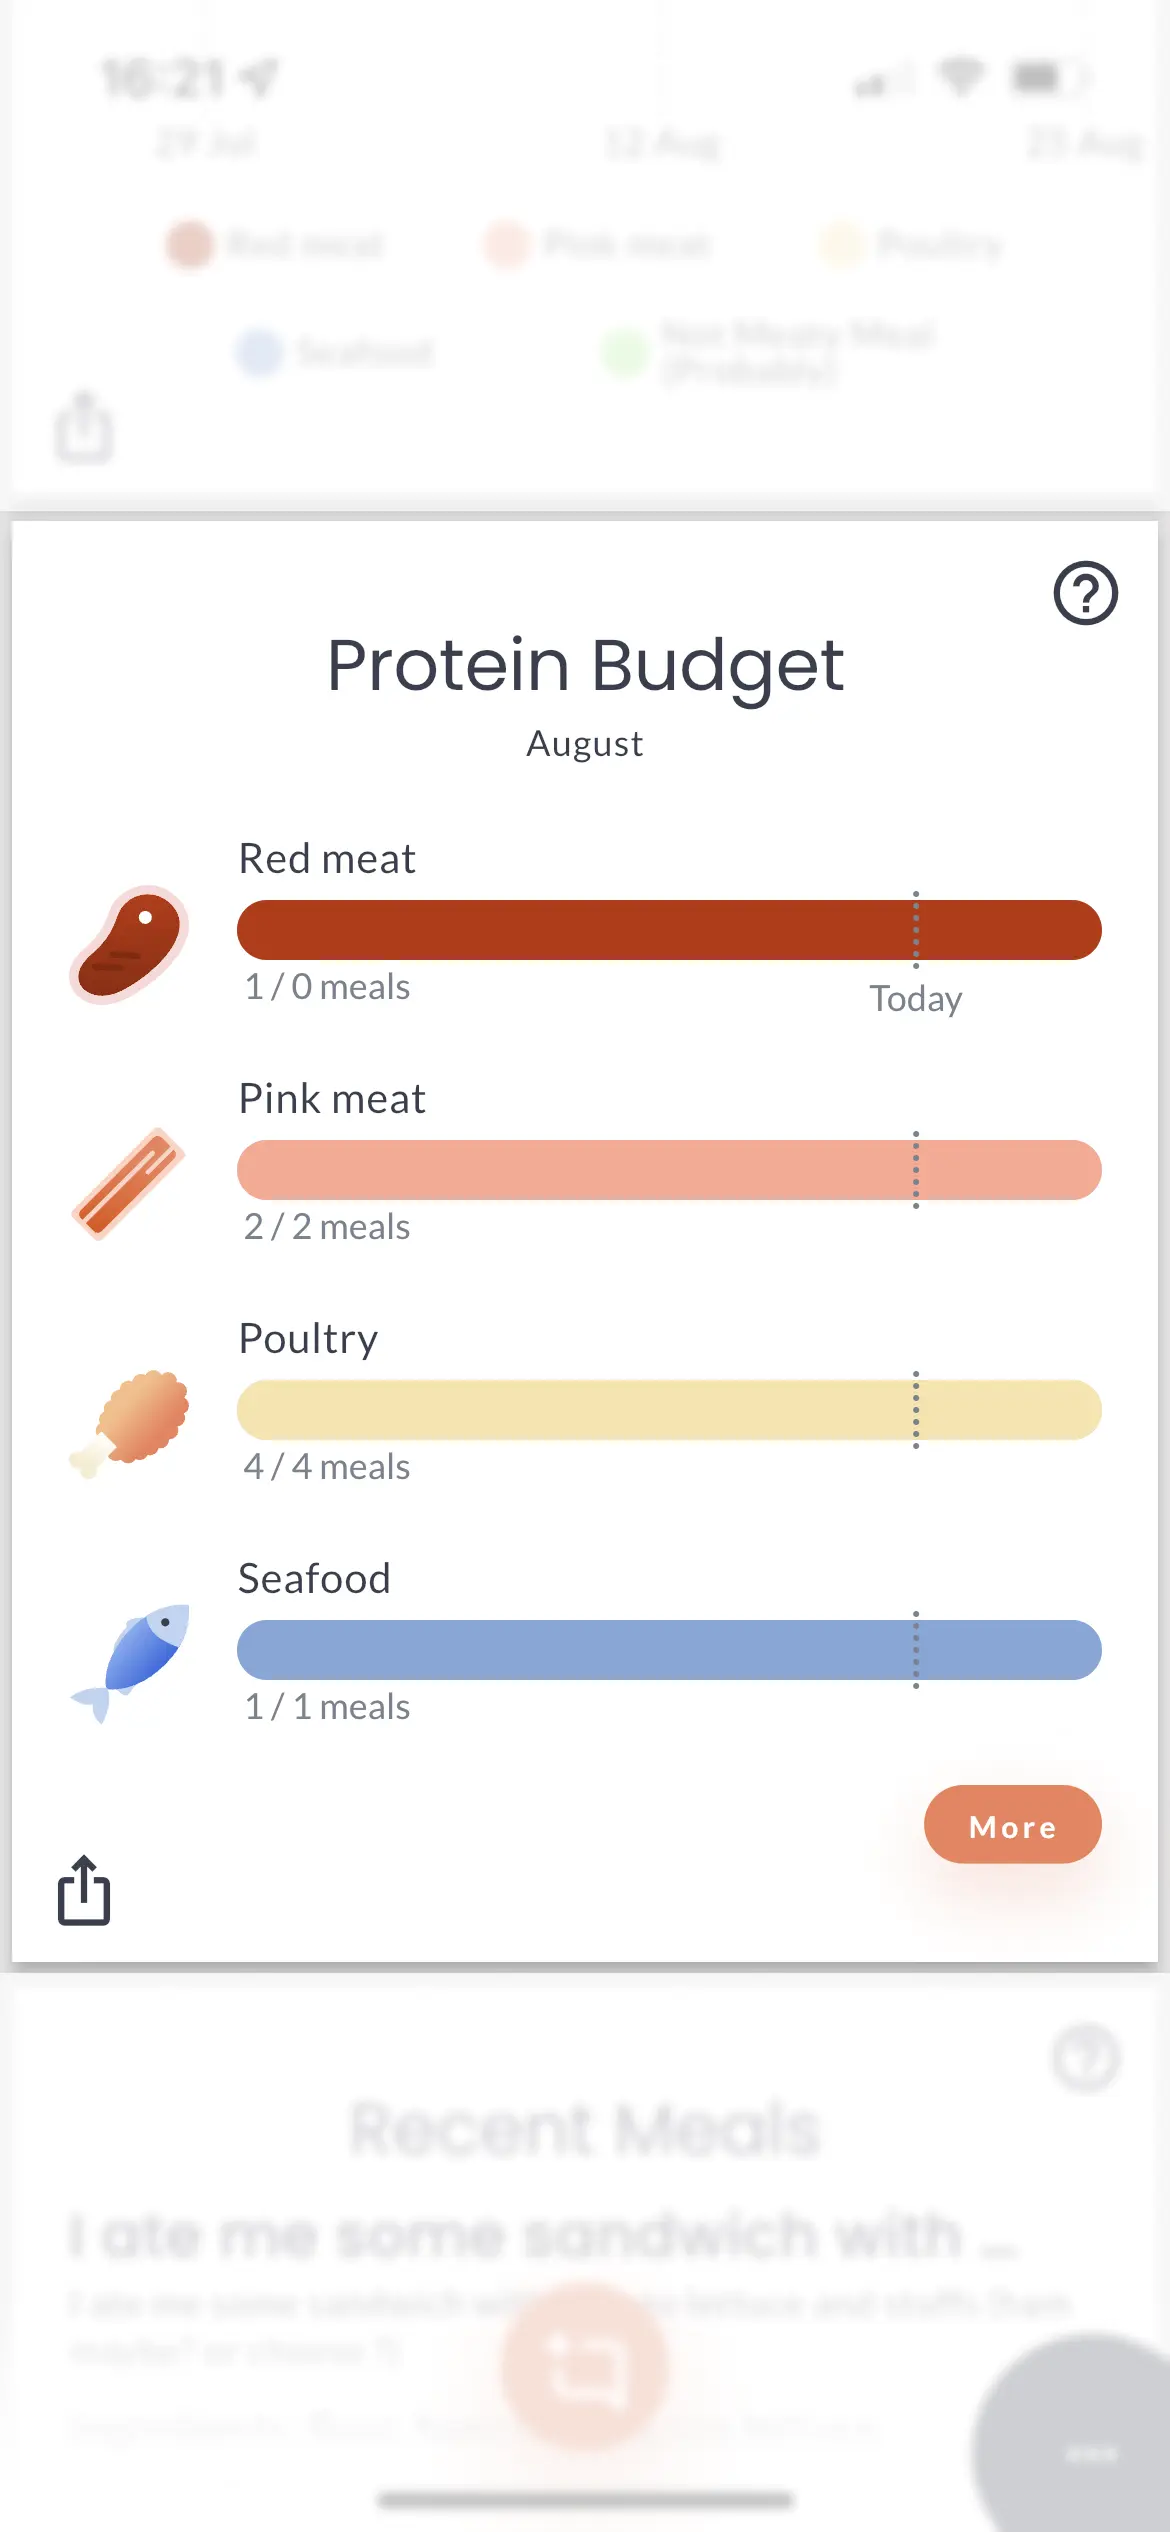
Protein Budget is at the heart of the FoodieApp environmental drive. It allows you to see where you are with meaty meals consumption. You can then decide if you've been munching on some form of animal-based product recently and should pick that veggie burger or maybe today is going to be the day to celebrate a cow day!
The consumption can be tracked across a few categories of animal products.

|
Red Meat - foods made with meat of mammalians. Products in this
category are the most environmentally intense.
Examples: beef, lamb |

|
Pink meat - foods also made with meat of mammalians, but which
production is more environmentally friendly.
Examples: pork, rabbits, kangaroo |

|
Poultry - Any products made with meat of brids.
Examples: chicken, duck, turkey |

|
Seafood - All the products made from meat of animals living in any body
of water (both freshwater and seas).
Examples: fish, prawns, clams, lobster, crab |
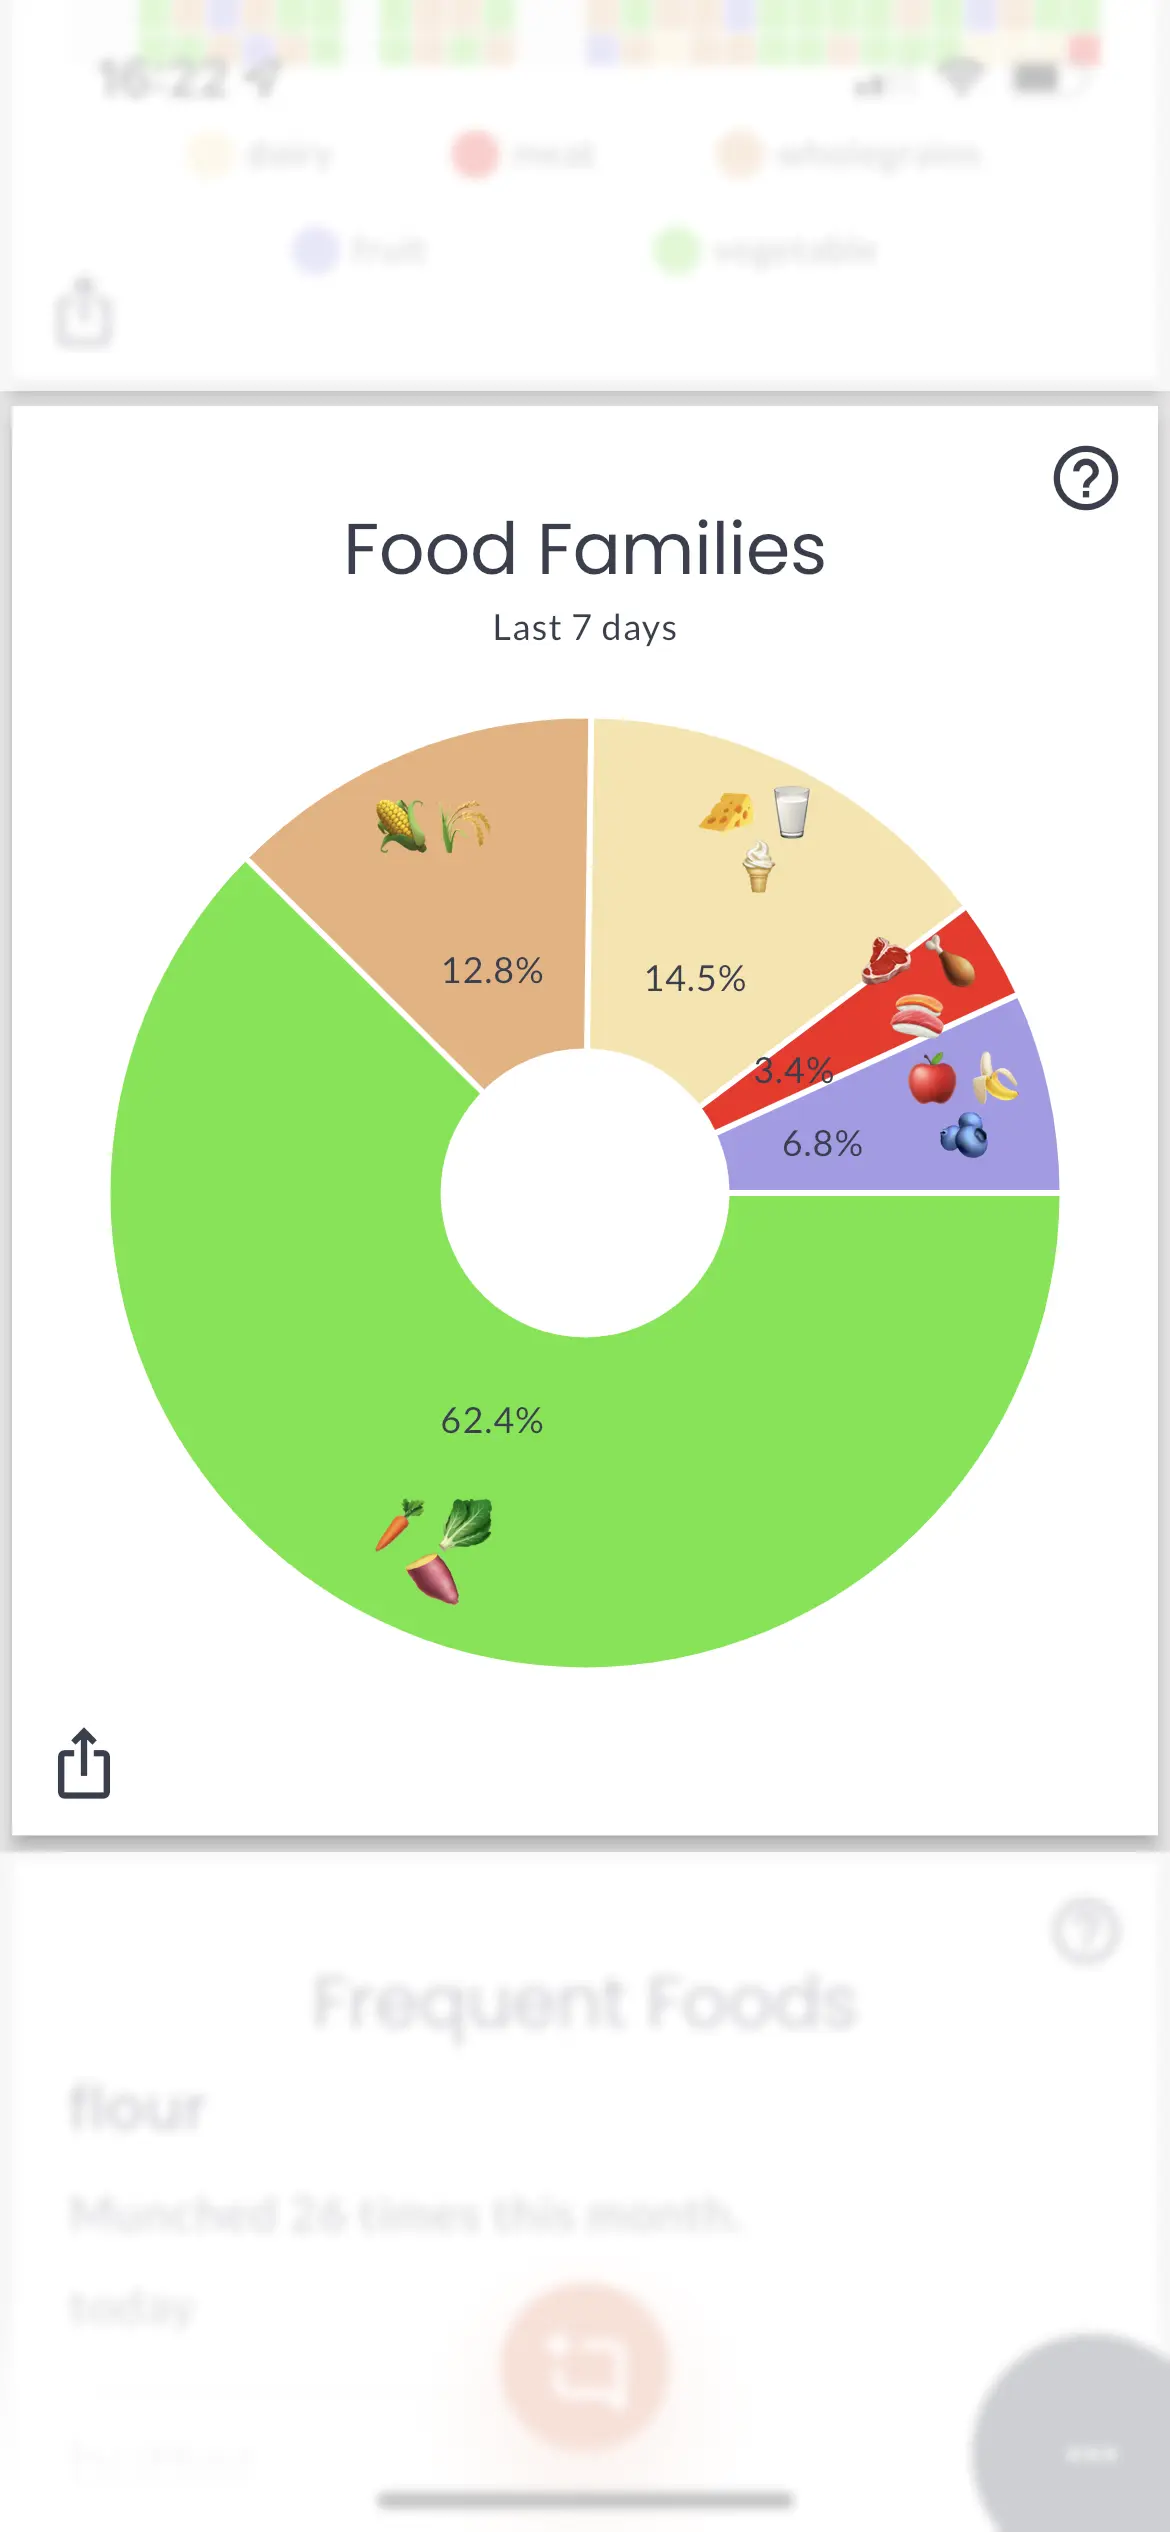
Food Families
The food families graph displays the proportion of your diet that is made up of the different food groups according to colour. The key to eating well is enjoying various nutritious foods from each of the Five Food Groups.
The 5 food families are:
- 🌾 Grain (cereal) foods, mostly wholegrain and/or high cereal fibre varieties.
- 🥕 Vegetables and legumes/beans.
- 🍎 Fruit.
- 🧀 Milk, yoghurt, cheese and/or other alternatives mainly reduced fat.
- 🥩 Lean meats, poultry, fish, eggs, tofu, nuts and seeds, and legumes/beans.
These five food families were inspired by the five food groups that make up the Australian Guide to Healthy Eating .
Recent Meals
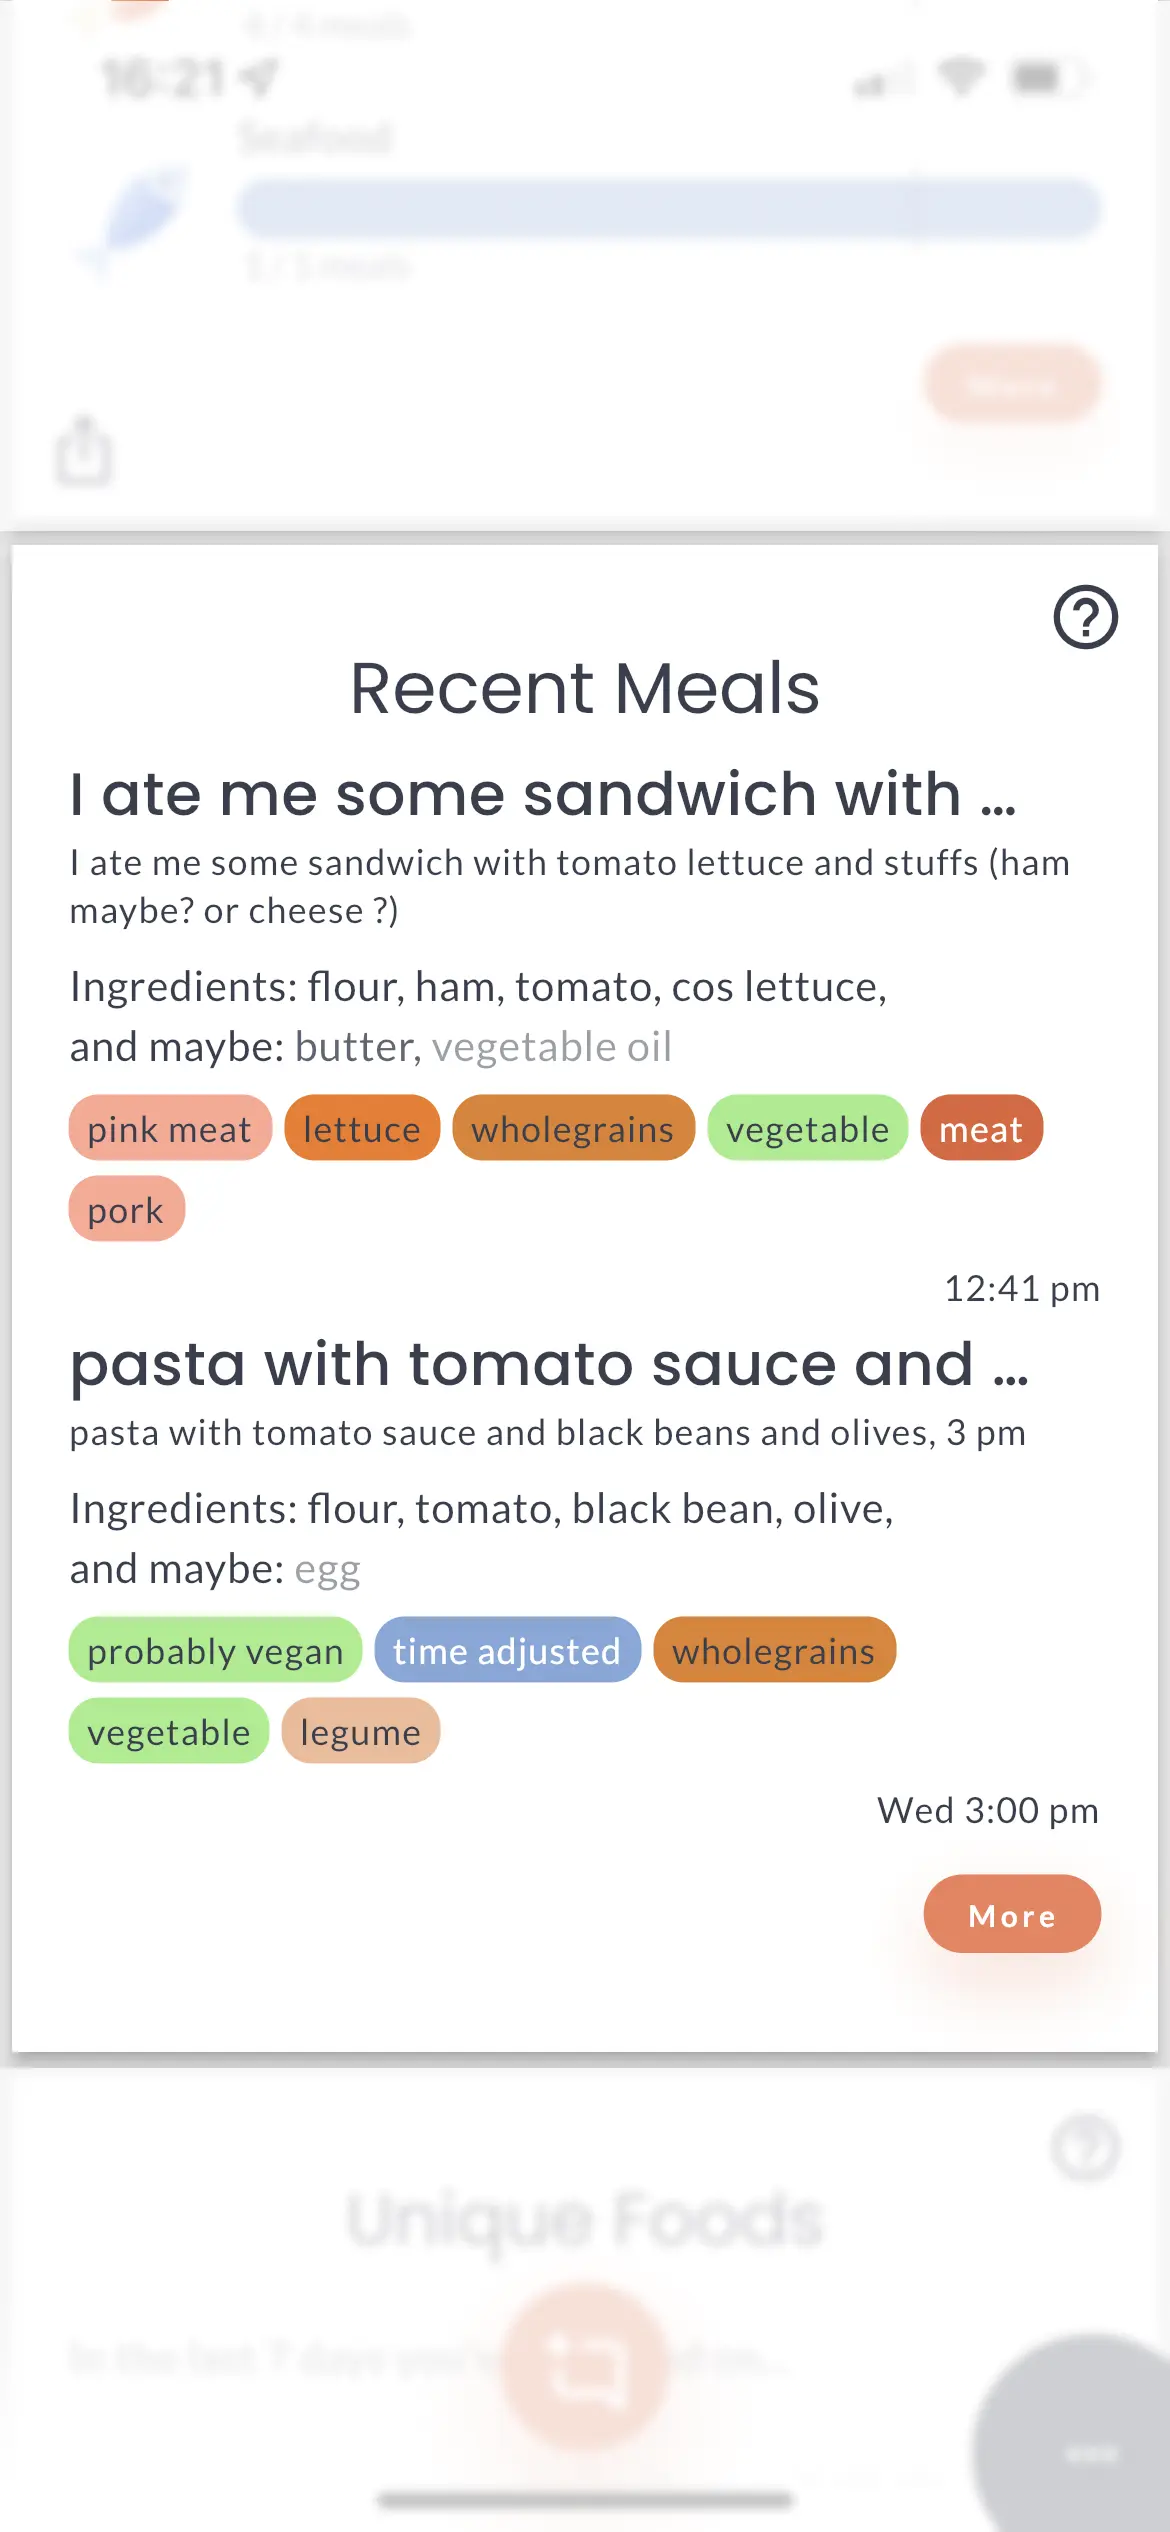
Under recent meals, you will find a list of meals you have entered into FoodieApp ordered from most to least recent.
The list of your meals will be displayed with a ...
- Heading - the meal you entered into the FoodieApp chat.
- Ingredients - the number of ingredients FoodieApp identified from the meal you entered.
- Tags - the category that represents the food item you consumed in the meal you ate. For example, citrus fruits, nuts, legumes, and vegetables.
The list of your recent meals also displays how long ago you consumed this meal or when you entered the meal with earlier entries.
Tap the 'More' button to see the complete meal history, with a graph representing a snapshot of your eating patterns across the week with a focus on the protein content of each meal.
This section also allows you to search your previous meal entries by name, ingredients and tags. When searched, previous entries that fit the search word will be listed below the graph and highlighted in the spot chart.
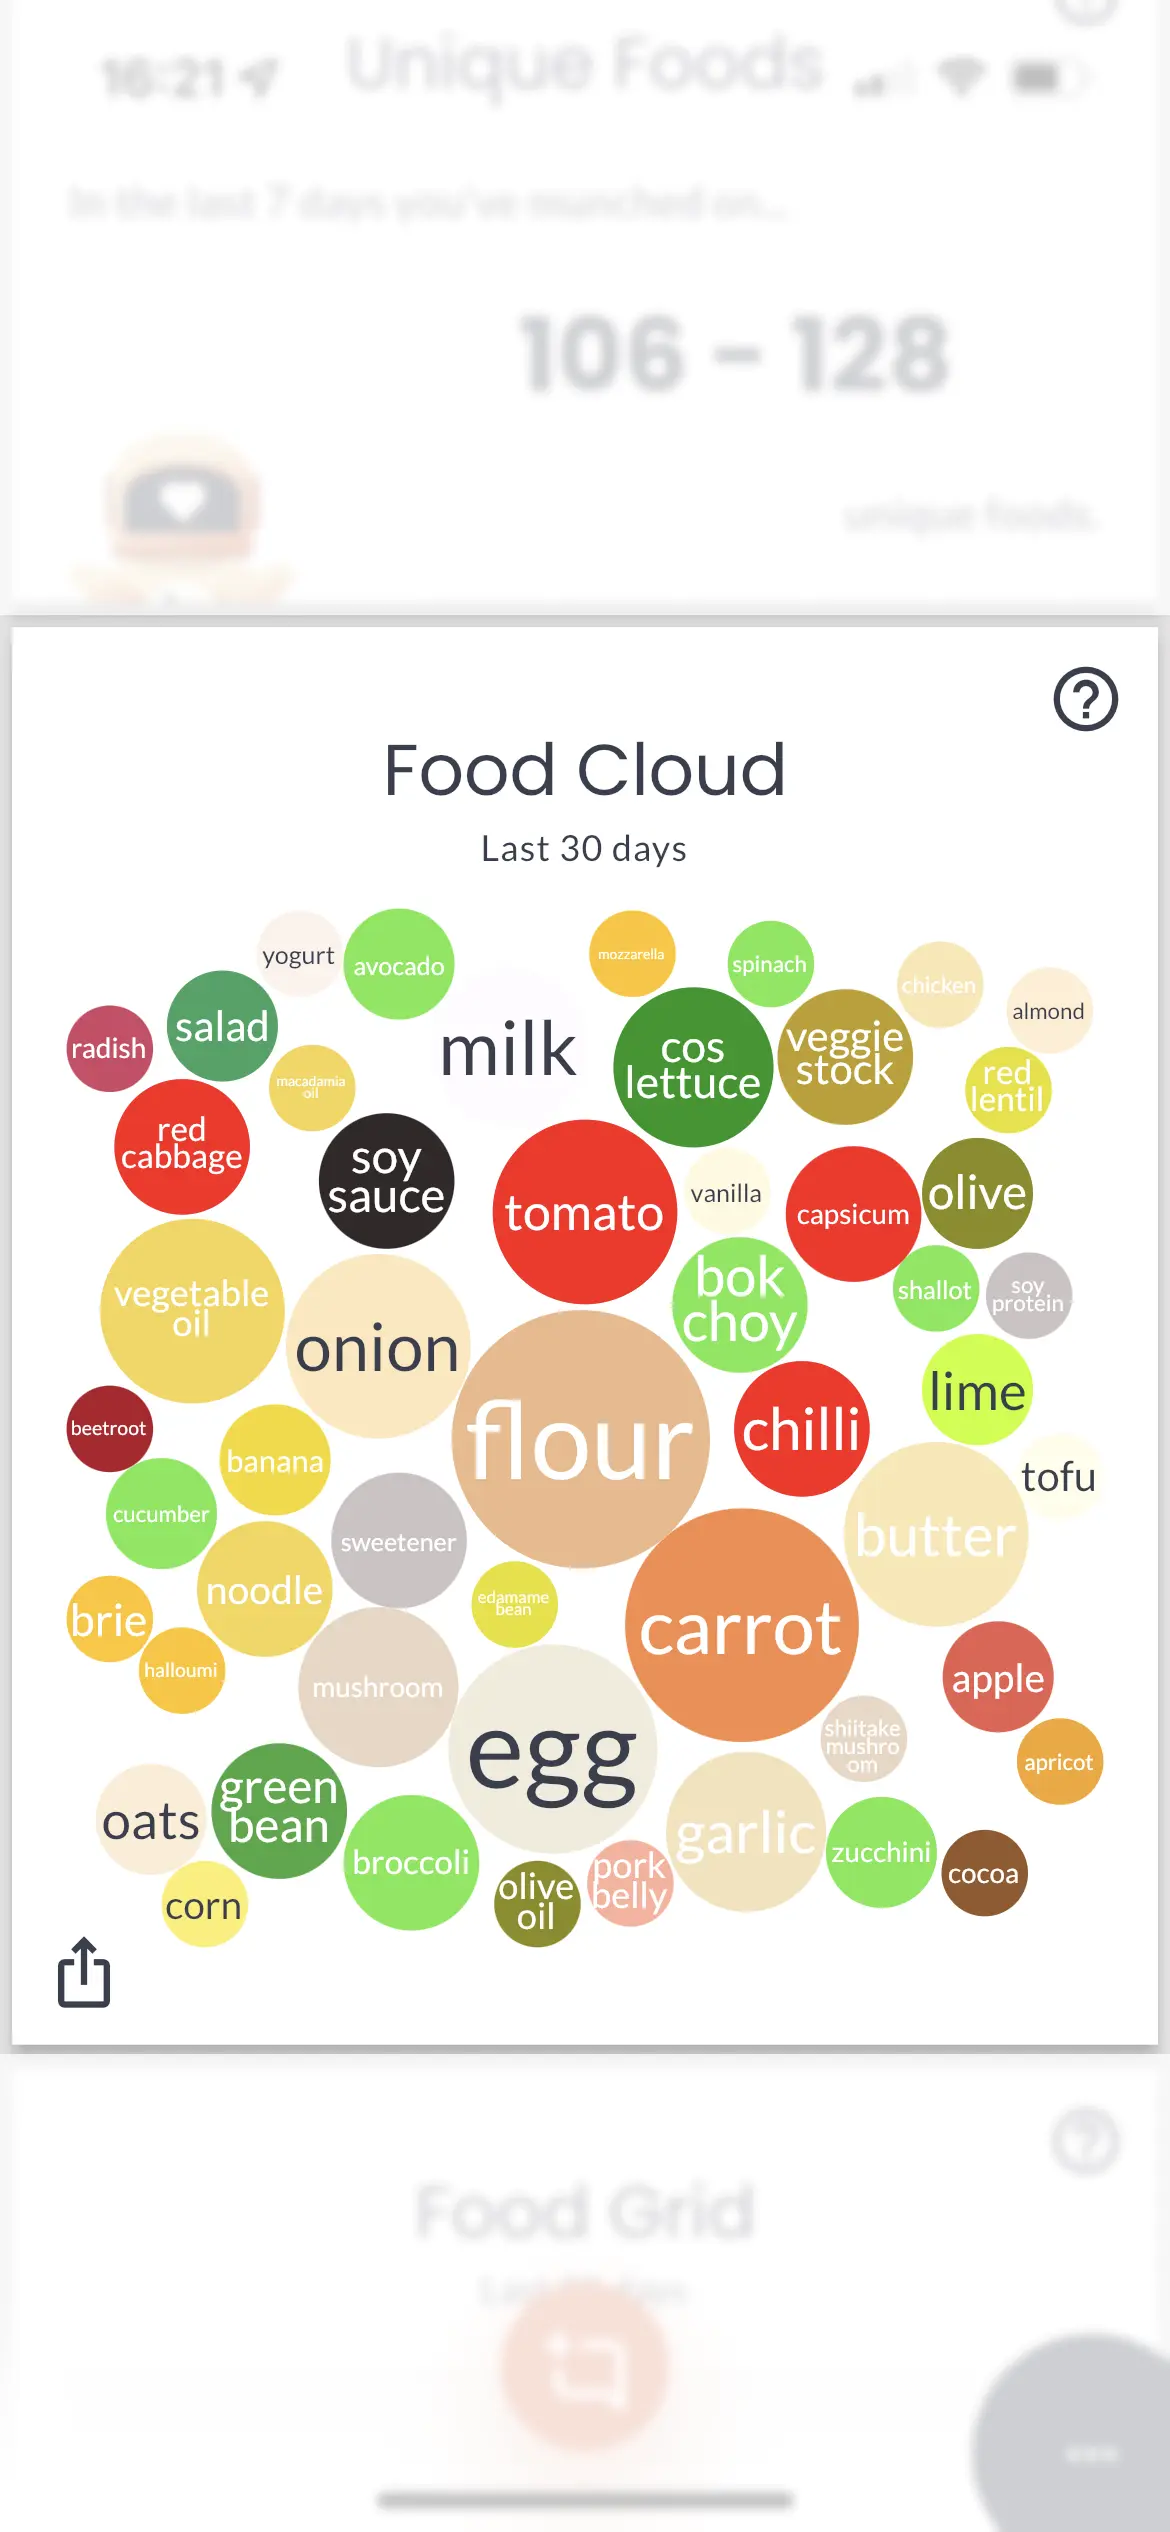
Food Cloud
Each dot on the food cloud represents a food item. The size of the spot indicates the amount of that food item you have consumed in the past 30 days. The smaller the dot, the fewer times you have munched on this food item, and the larger the dot, the more times you have consumed the food item.
After 30 days, the food item will disappear from the cloud unless you have consumed it again in 30 days.
Each colour of the item is representative of the colour of that specific food item. Raw and compound ingredients are usually represented as grey.
The food cloud gives you an insight into the balance and variety of your overall diet.
The balance is shown by the varied size of the dots displaying the foods you consume more and what foods you consume less of. The variety is demonstrated by the number and colours of the beads. The more spots and different colours, the more variety of foods you consume and vice versa.
Food Grid
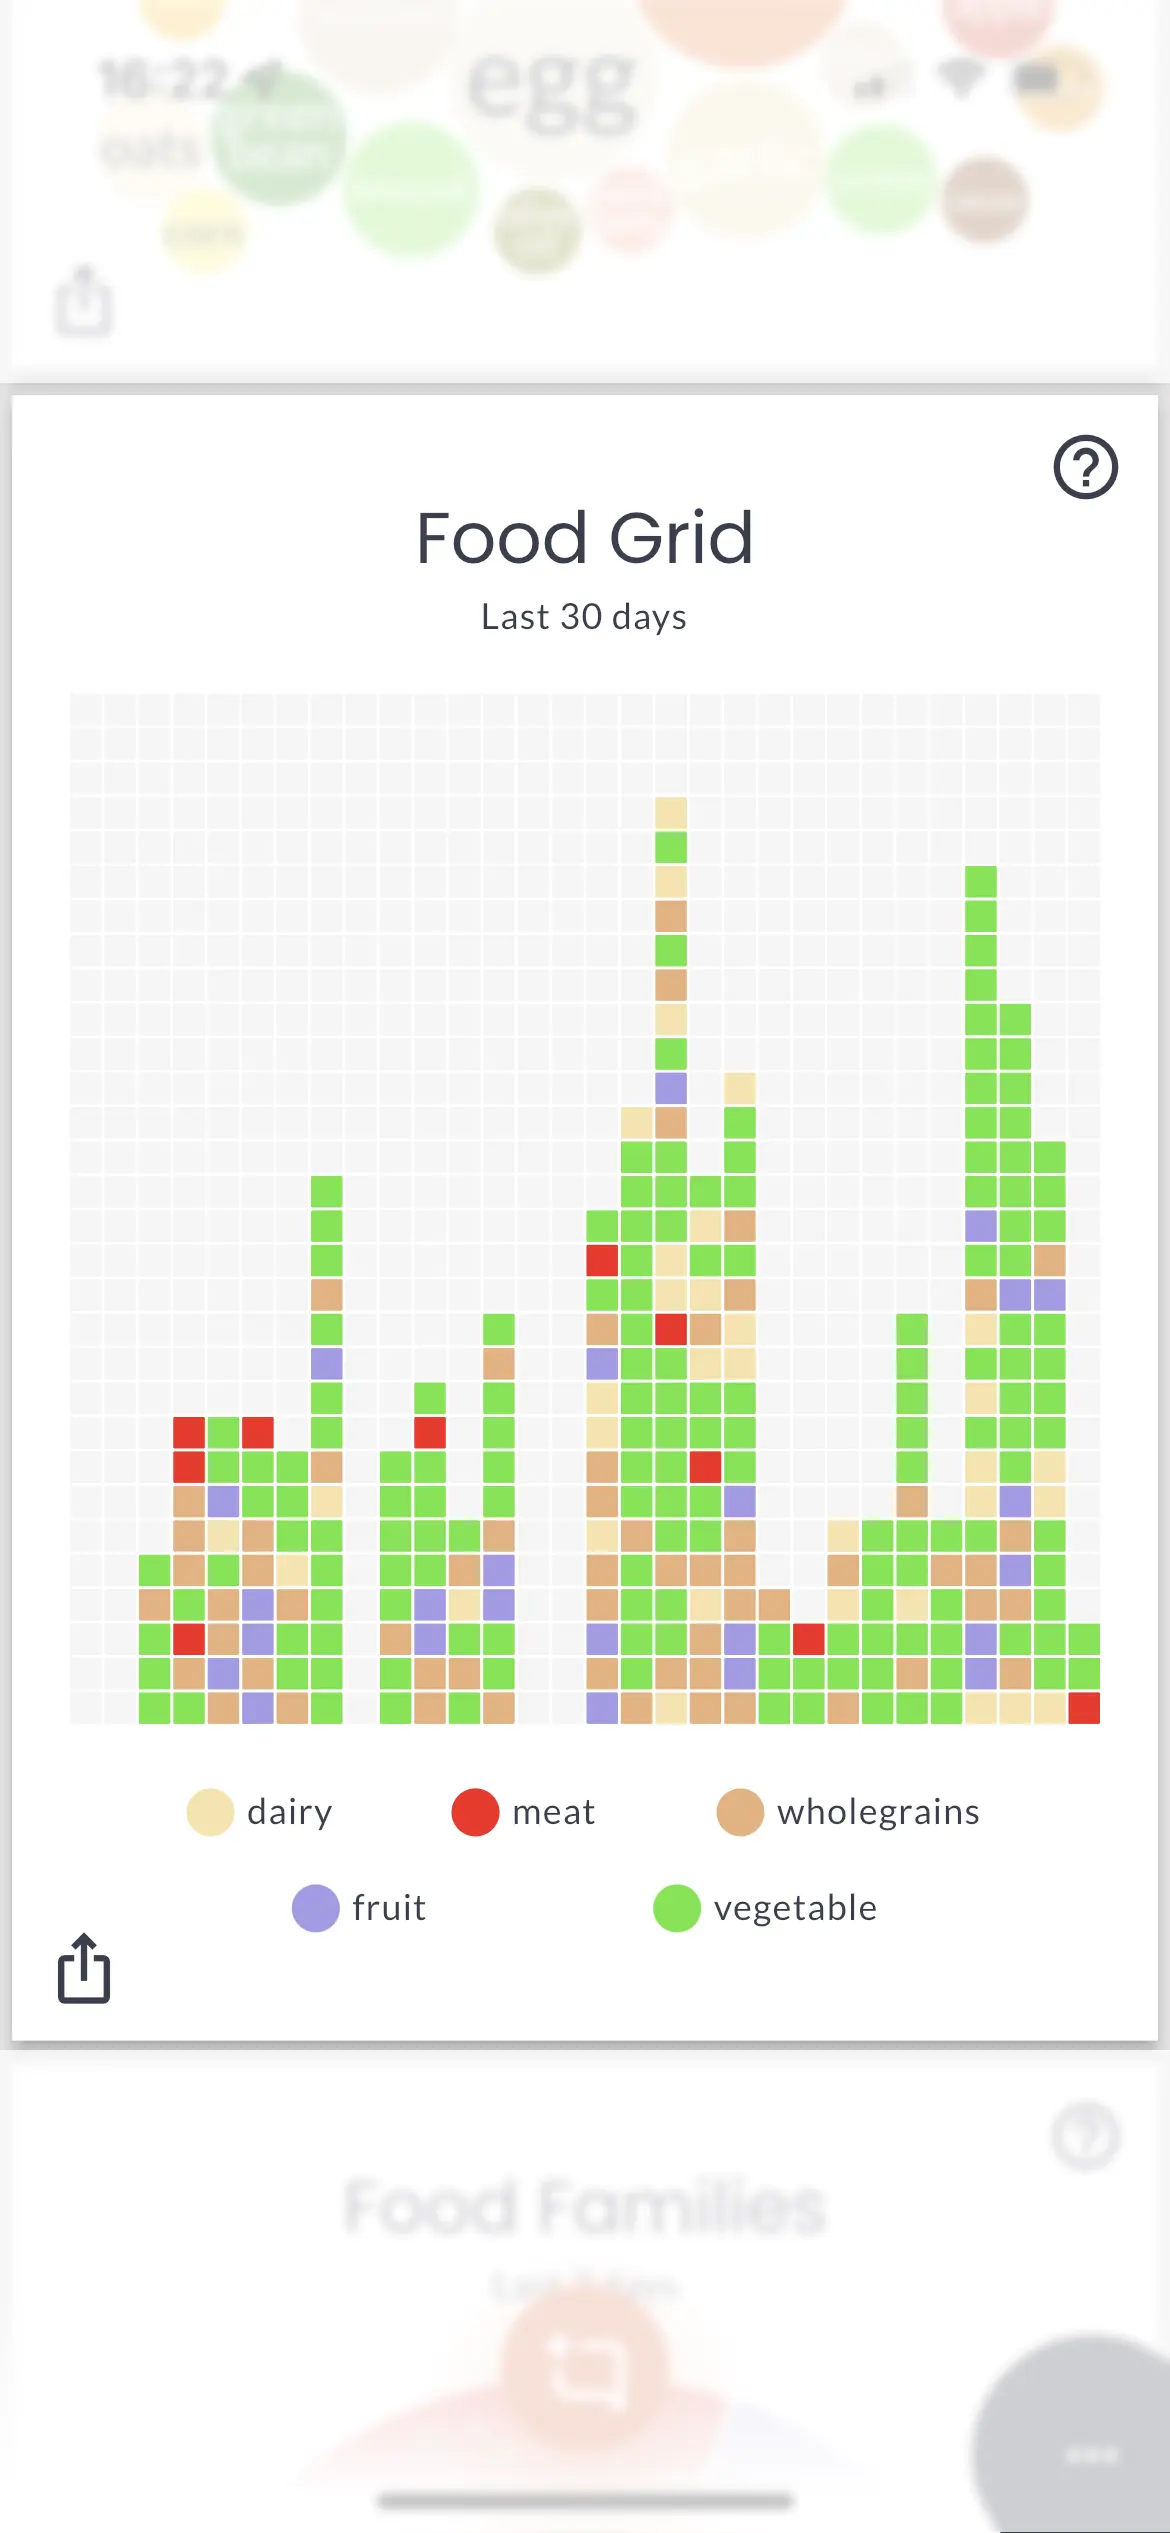
The food grid displays a visual of the food families you consume within 30 days, extracted from the FoodieApp chat.
The X-axis represents the day the food families are consumed from most recent (left) to oldest (right). The far column on the right will display today's entries, and the far column on the left will display entries from 30 days ago.
The Y-axis represents the number of food families consumed on that given day, categorised by the colour of the food family in order of consumption. The maximum number of food families recorded on a given day is 30.
The food grid was designed to show you the trend and balance of different food families consumed across 30 days.
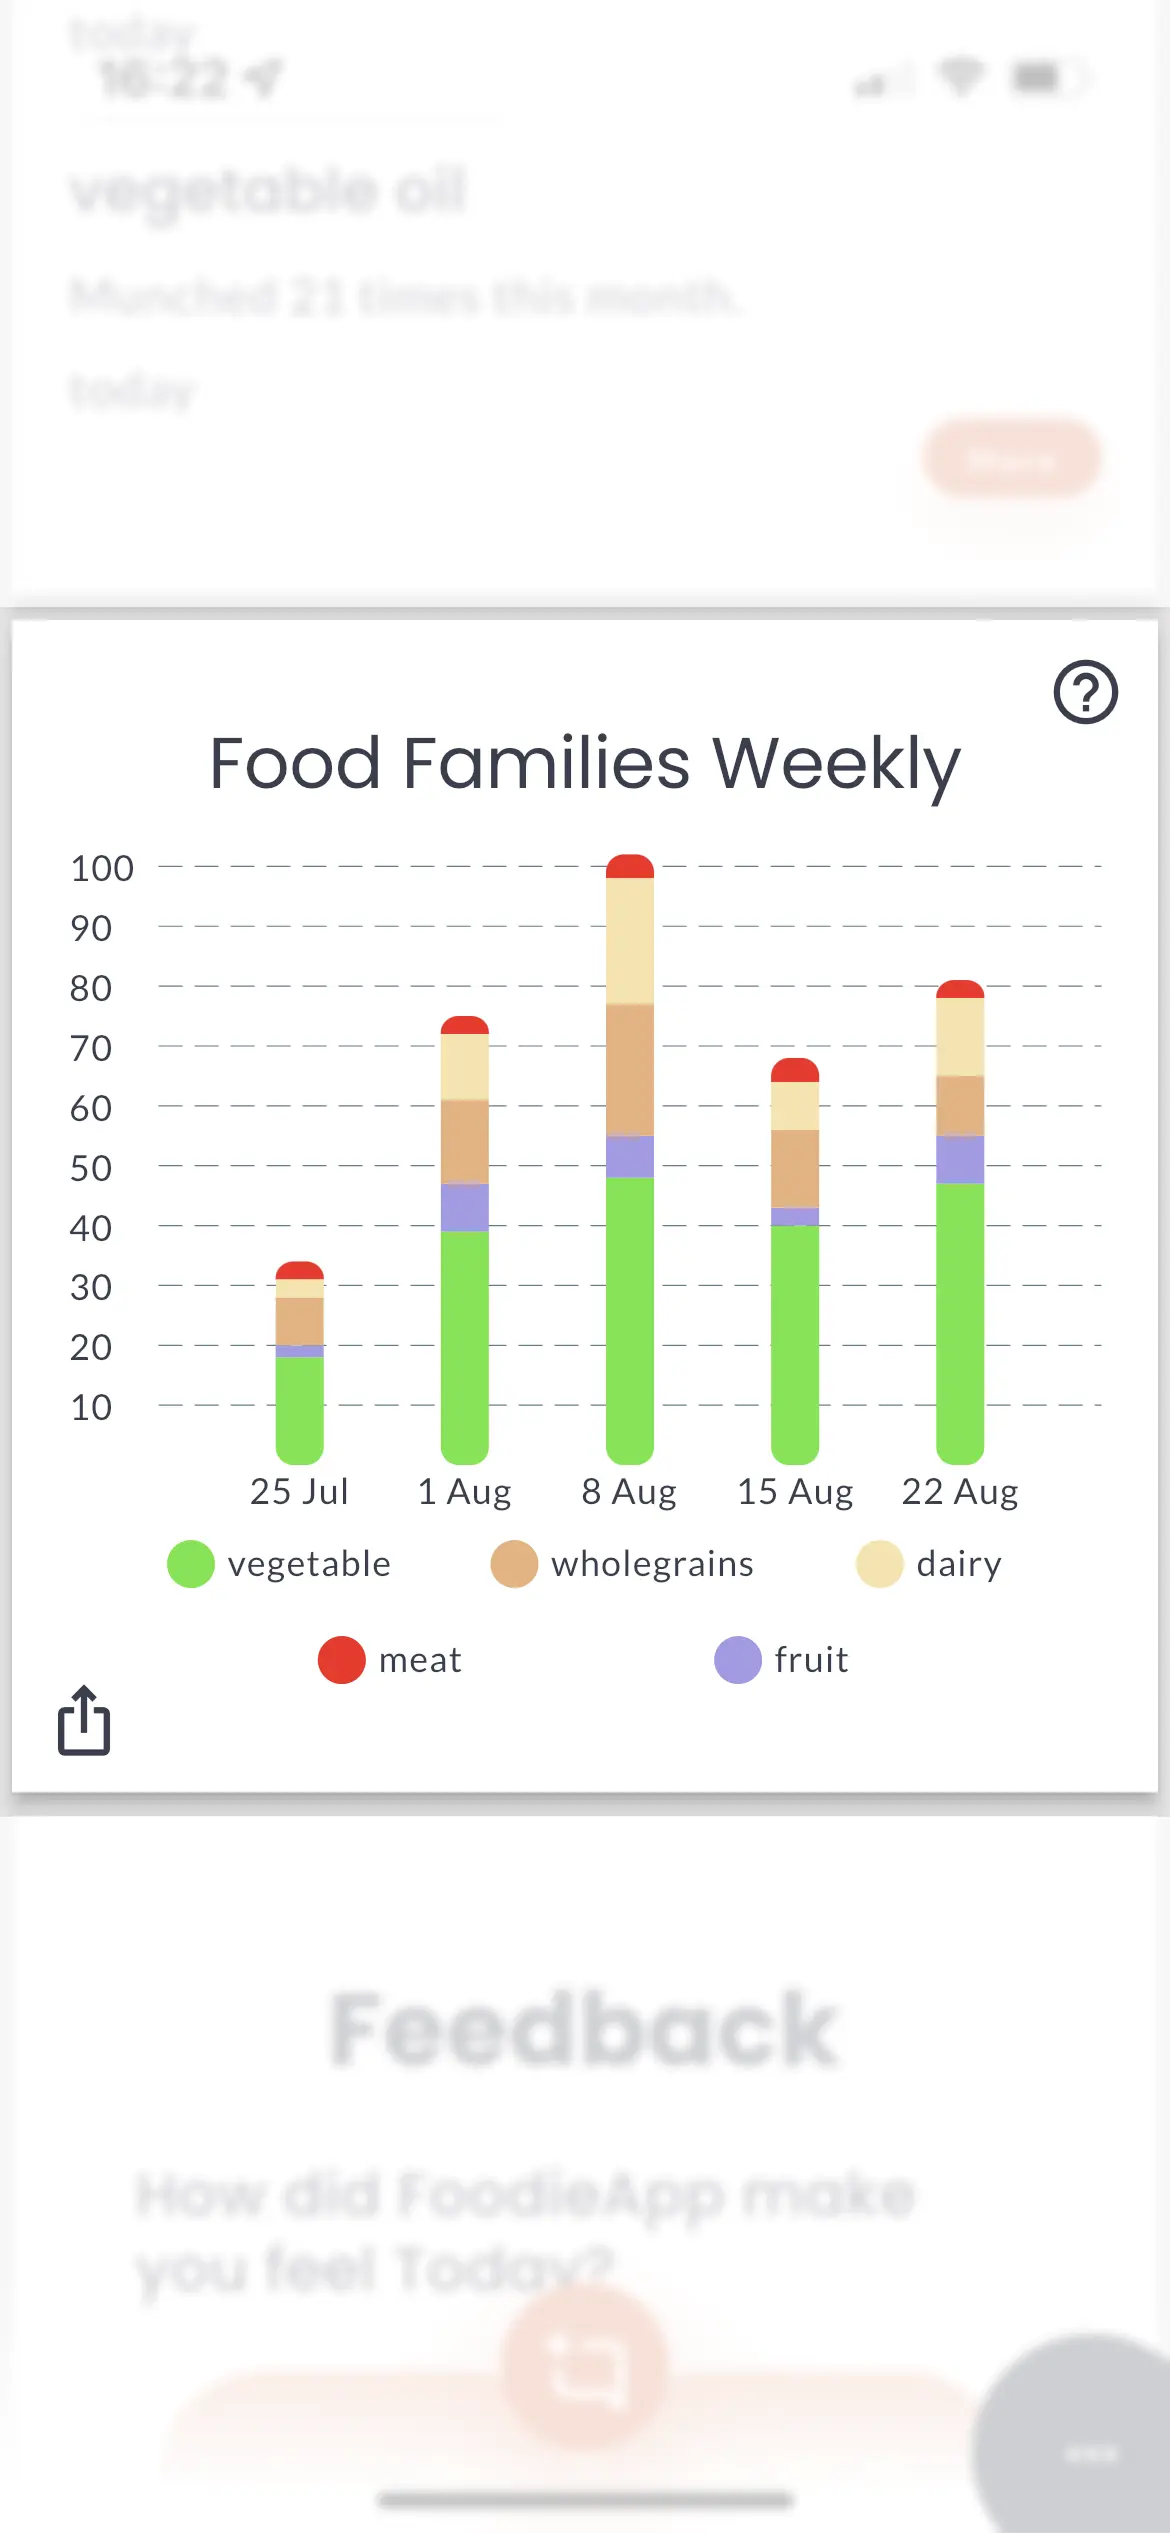
Food Families Weekly
The food families display the proportion of foods consumed across the week according to colour.
The X-axis represents the date and day of the foods entered, starting with Monday in the first column to the left. The Y-axis represents the number of foods consumed, entered and extracted from FoodieApp chat that day. The more foods consumed from a particular food family, the more significant colour portion it will take up in the column.
The food families display the balance of the different food groups you consume. Over time, you can view the trend in your food consumption and the balance of the different food families.
The key to eating well is to enjoy a variety of nutritious foods from each of the five food families.
Unique Foods
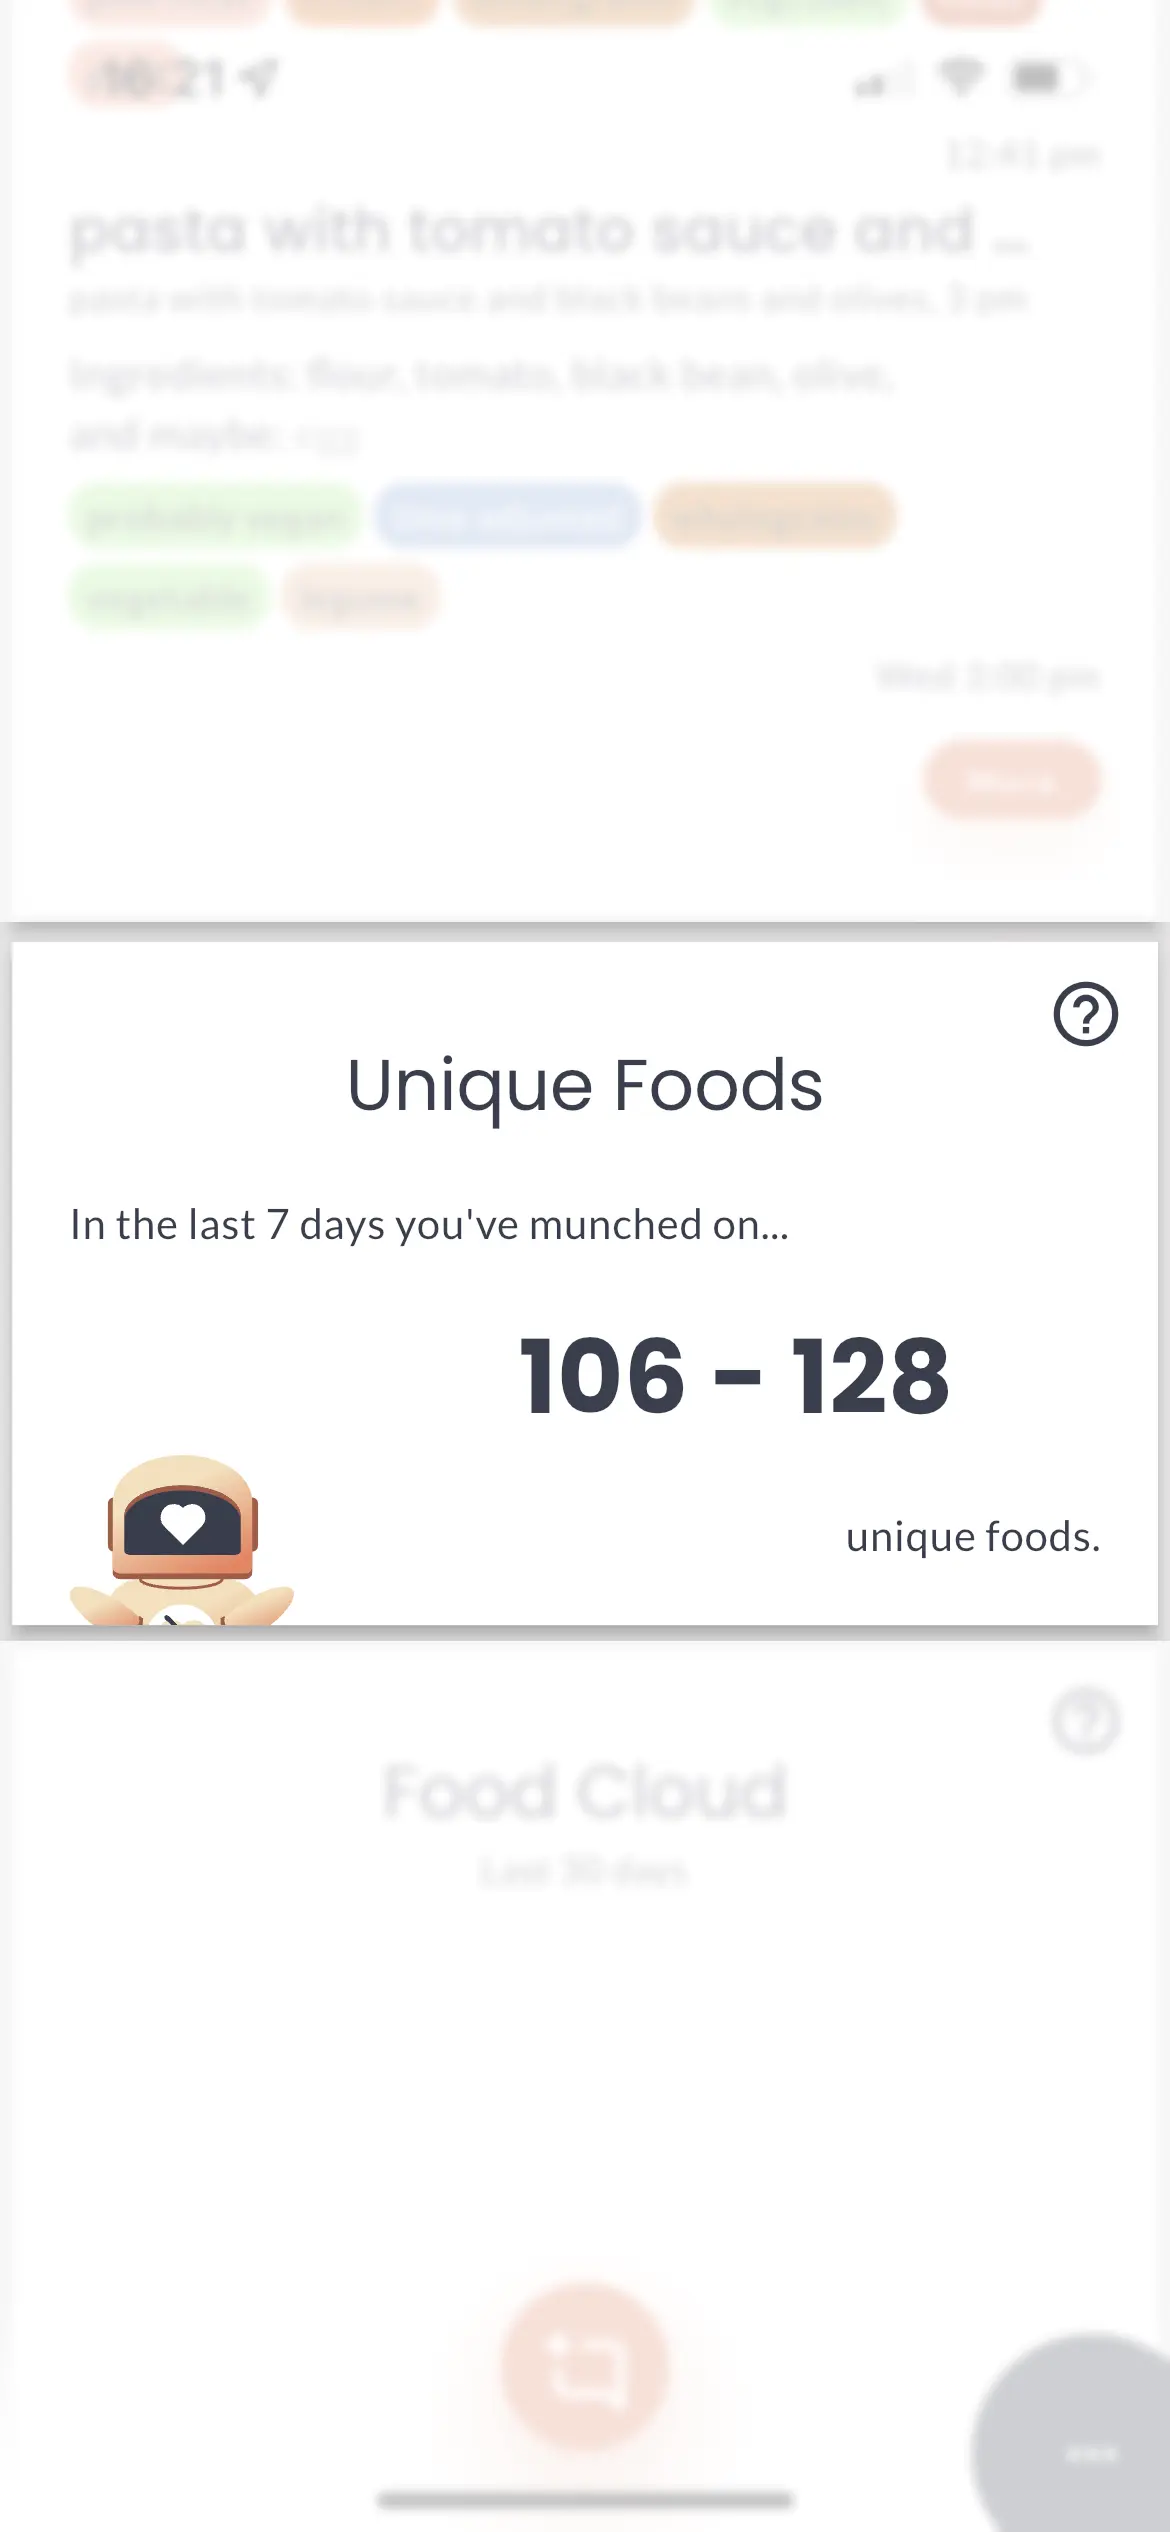
The number of unique foods represents the variety and diversity of ingredients in your everyday eating. The number of individual foods is predicted based on the foods you enter into our chat box, which we analyse.
A high number of unique foods represents a diverse diet with a lot of variety. This is desirable!
A low number of unique foods may mean you eat similar foods daily or minimal plant foods.